 ProMapRanker
Geo-Grid Rank Tracker: How Grid-Based Tracking Reveals Your True Rank
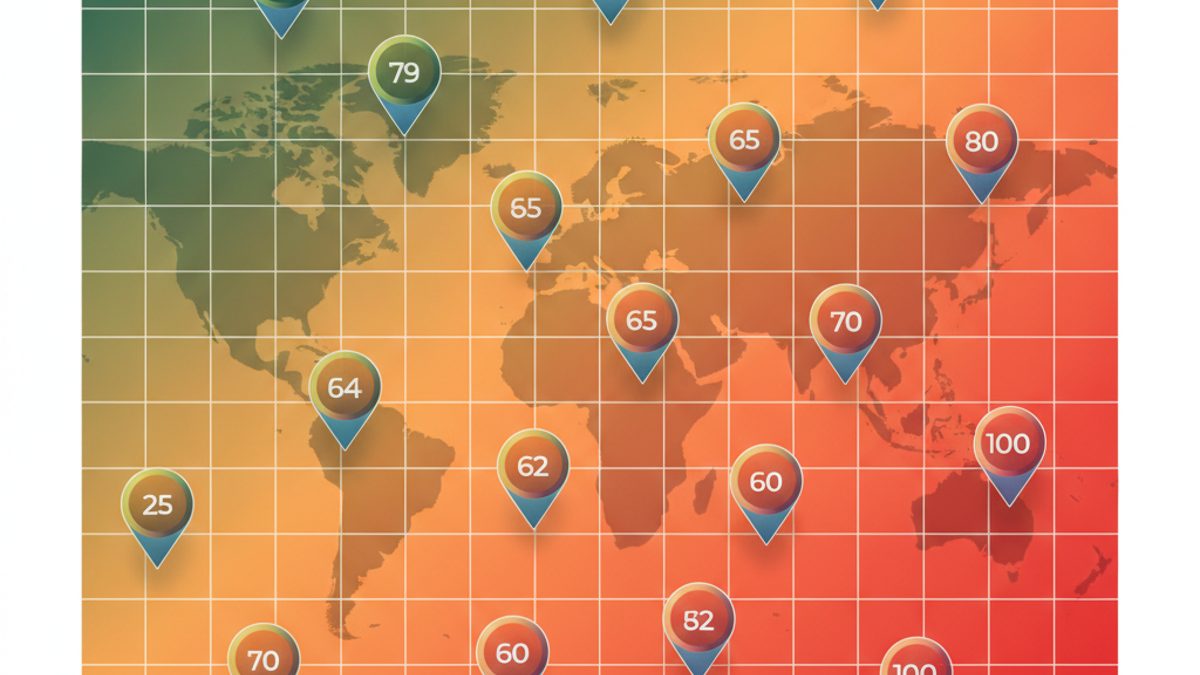
As Md Shihab Mia, founder of ProMapRanker, I often see businesses struggling to grasp their true local search visibility. A geo-grid rank tracker is an indispensable tool that precisely measures your business's local search performance across a defined geographical area, simulating searches from numerous points within a grid. Instead of showing a single, often misleading, ranking for your business address, it generates a visual heatmap revealing where your business ranks on Google Maps and in the local pack for specific keywords, providing an accurate picture of your reach and identifying critical gaps in your local SEO strategy. This granular data is vital for understanding how potential customers see you from different neighborhoods, allowing for targeted optimization that single-point tracking simply cannot achieve.
For any local business owner or SEO professional, understanding your local footprint is paramount. The difference between ranking #1 at your storefront and #15 just two miles away can mean hundreds of lost customers. Geo-grid tracking reveals these crucial discrepancies, transforming abstract SEO efforts into tangible, actionable insights. Let's delve into how this technology works and why it's not just a nice-to-have, but a fundamental requirement for competitive local search success.
What Exactly is a Geo-Grid Rank Tracker?
A geo-grid rank tracker is a specialized local SEO tool designed to measure a business's search engine ranking performance across a predefined geographical area using a grid of simulated search points. It visualizes ranking data on Google Maps and local pack results as a heatmap, providing a comprehensive, location-specific view of a business's visibility for target keywords.
Traditional rank tracking tells you where you rank from one specific location, typically your business address. However, Google's local algorithm heavily emphasizes proximity, meaning a search for "best pizza" from two miles away will likely yield different results than a search from directly across the street. A geo-grid tracker addresses this by simulating searches from dozens, even hundreds, of distinct points within a chosen radius or area. Each point on the grid represents a unique search query, and the collected data is then aggregated and displayed as a color-coded heatmap. This allows you to see, at a glance, exactly where your business is strong (often green) and where it needs improvement (yellow or red) across various neighborhoods.
Why is Geo-Grid Tracking Essential for Local Businesses?
Geo-grid tracking is essential because it reveals a business's true, dynamic local search performance beyond a single location, exposing critical ranking fluctuations across different neighborhoods and service areas. This granular data empowers businesses to identify "blind spots" in their local SEO, understand how proximity impacts their visibility, and optimize their Google Business Profile (GBP) and website content for maximum local reach.
Without a geo-grid tracker, businesses operate with a significant blind spot. A #1 ranking at your business address might give a false sense of security, while customers just a few blocks away might never see you in their search results. Consider a plumbing company in a large city: ranking well in their immediate vicinity is good, but they need to know if they're visible across their entire service area. A geo-grid scan would highlight areas where they're not ranking in the local pack, allowing them to adjust their GBP service areas, target local content, or pursue reviews from customers in those specific low-ranking zones. This granular insight also provides concrete data to prove SEO ROI to local clients, showing them the direct impact of optimization efforts on their local visibility.
How Does a Geo-Grid Rank Tracker Work?
A geo-grid rank tracker works by simulating a series of independent searches from multiple virtual points within a user-defined grid, collecting Google Maps and local pack results for target keywords at each point. This data is then processed to generate a visual heatmap, illustrating ranking performance across the specified geographical area.
The process typically involves a few key steps:
- Define Your Target Area: You specify a central business location and a radius (e.g., 5 miles, 10 miles) or a custom polygon.
- Set Grid Parameters: You choose the grid density, such as a 5x5 grid or a 7x7 grid, and the spacing between each point (e.g., 0.5 miles, 1 mile, 2 miles). Denser grids (more points, smaller spacing) provide more detailed insights but require more processing.
- Select Keywords: You input the primary keywords relevant to your business (e.g., "HVAC repair near me," "dentist in [city name]," "pizza delivery").
- Data Collection: The tool uses proxy IP addresses or other methods to simulate a search query for each keyword from every single point on the grid. It then records the ranking position of your business (and often competitors) in the Google Maps pack and local organic results.
- Heatmap Generation: All the collected data points are compiled and rendered into a color-coded heatmap. Typically, green indicates top rankings (e.g., positions 1-3), yellow indicates moderate rankings (e.g., 4-10), and red indicates lower or non-existent rankings (e.g., 10+ or not found).
This systematic approach provides a comprehensive view that no manual search or single-point tracker could ever achieve, revealing the nuances of Google's proximity-based ranking.
What Ranking Factors Influence Your Geo-Grid Performance?
Your geo-grid performance is primarily influenced by a blend of proximity, relevance, and prominence, encompassing rigorous Google Business Profile optimization, robust website SEO, and a strong online reputation. These factors collectively determine how visible your business is from various search points across a geographical grid.
Understanding these factors is crucial for improving your geo-grid heatmap. Here's a breakdown:
-
Google Business Profile (GBP) Optimization: This is arguably the most critical factor for local search.
- Accuracy and Completeness: Ensure all information is 100% accurate and complete, including name, address, phone number, website, hours, and services.
- Primary and Secondary Categories: Choose the most specific and relevant categories for your business. For instance, a "HVAC Contractor" is better than just "Contractor."
- Service Areas: Clearly define your service areas, especially if you're a service-area business. Google Business Profile Help notes that your service area should generally be within a 2-hour driving distance of your primary location for optimal relevance (Google Business Profile Help).
- Photos and Videos: High-quality, relevant photos (10+ is a good starting point) and videos significantly boost engagement and prominence.
- Reviews and Ratings: Consistently acquiring new, positive reviews with relevant keywords from customers, and actively responding to all reviews, signals prominence and trust. Link: Do Google Reviews Help SEO?
- Posts: Regular GBP posts keep your profile active and provide fresh content for Google to index.
ProMapRanker's built-in GBP audit feature can quickly highlight areas for improvement.
- Proximity: This refers to the physical distance between the searcher and your business. It's the core reason geo-grid tracking exists. The closer the searcher, the more likely your business will appear in local results. While you can't change your physical location, optimizing other factors can help you "reach" further.
-
Relevance: How well your business's GBP and website content match the search query.
- Keyword Integration: Naturally include relevant keywords in your GBP description, services, products, and website content.
- Content Quality: Provide comprehensive, helpful content on your website that directly addresses customer needs related to your services.
-
Prominence/Authority: How well-known and authoritative your business is, both online and offline.
- Citations and Directories: Consistent name, address, phone (NAP) information across numerous online directories (e.g., Yelp, Yellow Pages, industry-specific sites). Aim for 20+ quality citations. Link: Top Local Citation Sites.
- Backlinks: Quality backlinks from other reputable websites signal authority to Google.
- Online Mentions: General mentions of your business across the web, even without a direct link.
- Website Authority: A well-structured, fast-loading, mobile-friendly website with excellent user experience. This includes strong Core Web Vitals scores: Largest Contentful Paint (LCP) under 2.5 seconds, First Input Delay (FID) under 100ms, and Cumulative Layout Shift (CLS) under 0.1 (web.dev/vitals).
By focusing on these interconnected factors, businesses can significantly improve their geo-grid heatmap and capture more local search visibility. For a deeper dive into these, check our article on Google Maps Ranking Factors Breakdown.
Interpreting Your Geo-Grid Heatmap: A Practical Guide
Heatmaps visually represent your local search rankings, with colors indicating performance (e.g., green for top ranks, red for low ranks), thereby revealing strong visibility areas and critical weak spots. Understanding these color gradients allows you to pinpoint geographical areas requiring immediate SEO attention and assess the effectiveness of your optimization efforts.
Here’s how to effectively interpret your geo-grid heatmap:
- Understand the Color Legend: Every geo-grid tool uses a color legend to indicate ranking positions.
Color Ranking Position Interpretation Dark Green 1-3 Excellent visibility, appearing in the local pack. Light Green 4-6 Good visibility, often requires scrolling in the local pack. Yellow 7-10 Moderate visibility, typically below the local pack, on Google Maps. Orange 11-20 Low visibility, requires significant scrolling or zooming on Maps. Red 20+ or Not Found Very poor or non-existent visibility. Critical areas for improvement. - Identify Your Strongholds: Areas with dark green indicate where your business is performing exceptionally well, often appearing in Google's coveted local 3-pack. These are your most effective service zones or neighborhoods where your SEO efforts are paying off.
- Pinpoint Weak Spots: Red or orange areas are critical. These indicate regions where your business is not ranking well, if at all. This might be due to intense competition, lack of proximity, or insufficient local SEO signals for those specific geographical points. These are your immediate targets for optimization.
- Analyze Competitor Overlays: Many tools, including ProMapRanker, allow you to overlay competitor heatmaps. This reveals where competitors are outperforming you, helping you understand their local dominance and identify opportunities to gain market share.
- Track Progress Over Time: Regularly running geo-grid scans allows you to see how your heatmap changes after implementing SEO strategies. Are your red areas turning yellow or green? Is your green expanding? This visual progression is invaluable for demonstrating ROI.
- Connect to Service Areas: For service-area businesses, align your heatmap with your actual service zones. If you serve a 15-mile radius, ensure your heatmap shows good coverage across that entire area, not just near your physical address.
For a detailed breakdown on how to gain insights from these visuals, see our guide on How to Read a Local Search Grid.
Beyond Rankings: Understanding Share of Local Voice (SoLV) and Average Rank Position (ARP)
While individual rankings are crucial, metrics like Share of Local Voice (SoLV) measure your total visibility and market share against competitors, while Average Rank Position (ARP) provides an aggregated view of your average ranking across the entire grid for specific keywords. These advanced metrics offer a holistic understanding of your local search presence, moving beyond single data points to strategic insights.
At ProMapRanker, we emphasize these metrics because they provide a more comprehensive and actionable view of your local SEO performance:
- Share of Local Voice (SoLV): Imagine all the local search results for a specific keyword within your grid. SoLV quantifies your percentage of that total visibility compared to your key competitors. If your SoLV for "HVAC repair" is 25% across a 10-mile grid, it means your business appears in 25% of all top local results compared to the combined visibility of your monitored competitors. This metric helps you understand your market share and how much dominance you hold in your local market. It's not just about ranking #1; it's about how often you rank within the visible local pack compared to others. This is a powerful metric for strategic planning and competitive analysis.
- Average Rank Position (ARP): Instead of looking at individual points, ARP calculates your average ranking across all the grid points for a specific keyword. If you have a 5x5 grid (25 points) and your business ranks #1 at 10 points, #5 at 10 points, and #10 at 5 points, your ARP would be the average of all those positions. A lower ARP indicates stronger overall performance across the entire geographical area. While a heatmap shows you the 'where,' ARP gives you a single, digestible number to track overall improvement over time.
These metrics move you beyond reactive optimization to proactive, strategic local SEO. By tracking SoLV and ARP, you can measure the impact of your campaigns on your overall market presence and make data-driven decisions to increase your local search dominance.
Step-by-Step: Leveraging Geo-Grid Data for Local SEO Improvement
Use geo-grid insights to refine your Google Business Profile details, target local content creation, strategically acquire reviews from specific areas, and effectively outmaneuver competitors. This methodical approach transforms raw ranking data into a clear roadmap for enhancing your local visibility and attracting more customers.
Here’s a practical checklist to guide your optimization efforts:
- Run Your Initial Geo-Grid Scan: Start with ProMapRanker to establish a baseline. Choose your primary keywords and set an appropriate grid size and density for your service area (e.g., a 7x7 grid with 1-mile spacing for dense urban areas, or 5-mile spacing for rural regions).
- Identify Weak Spots on the Heatmap: Look for the red and orange areas. These are the geographical zones where your business has low or no visibility. Note the specific neighborhoods or zip codes associated with these weak spots.
- Conduct a Google Business Profile (GBP) Audit for Those Areas: Use ProMapRanker's free GBP audit to pinpoint potential issues. Check if your service areas are correctly defined to cover these weak zones. Ensure your GBP categories are precise and comprehensive.
- Optimize Your GBP:
- Categories: Add relevant secondary categories if applicable.
- Service Areas: Adjust your service areas to explicitly include the low-performing zones.
- Description & Services: Naturally integrate keywords relevant to those areas into your GBP description and services list. Ensure your offerings are fully detailed.
- Photos: Upload more high-quality, geotagged photos, especially if you have images taken within or representing the weak spots.
- Strategize for Reviews from Clients in Weak Zones: Actively encourage satisfied customers located in your red/orange areas to leave reviews. Their proximity to those grid points can boost your relevance signals for future searches originating there.
- Create Location-Specific Content: Develop blog posts, landing pages, or service pages tailored to the low-ranking areas. For example, "Best HVAC Repair in [Weak Neighborhood Name]" or "Plumbing Services for [Specific Local Landmark Area]." Integrate relevant local keywords.
- Build Local Citations and Backlinks: For the identified weak areas, seek out local online directories, community websites, or local news outlets to secure citations and backlinks that mention your business and these specific locations.
- Monitor Changes with Regular Scans: After implementing optimizations, run new geo-grid scans (e.g., weekly or bi-weekly). Compare your new heatmap to the previous ones to visually track improvements. Watch for red turning to yellow, and yellow turning to green.
- Analyze Competitor Grids: Regularly run geo-grid scans for your top competitors. This helps you understand their strengths and weaknesses, allowing you to identify new opportunities to outrank them in specific areas where they might be vulnerable.
By systematically addressing the insights provided by your geo-grid data, you can significantly enhance your local search footprint and capture a larger share of local customers.
Choosing the Best Geo-Grid Rank Tracker for Your Needs
When selecting a geo-grid rank tracker, look for tools offering accurate data, customizable grids, competitor tracking, comprehensive reporting, and additional insights like Share of Local Voice (SoLV) and GBP audits. The best tool should integrate seamlessly into your local SEO workflow, providing actionable data to drive strategy.
Here are key features and considerations:
- Accuracy and Reliability: The data must be accurate. The tool should use robust methods to simulate searches from each grid point without being blocked or providing skewed results.
- Customizable Grid Settings: You need flexibility to define grid size, density, and spacing to match different geographical needs (e.g., a tight 0.5-mile grid for a dense city center versus a 5-mile grid for a rural service area).
- Keyword Tracking Capacity: Ensure the tool supports the number of keywords you need to track across all your grids.
- Competitor Tracking: The ability to track multiple competitors on the same grid allows for invaluable competitive analysis and market share insights.
- Comprehensive Reporting: Beyond just heatmaps, look for detailed reports, historical data comparison, and export options.
- Additional Metrics: Tools like ProMapRanker go beyond basic rankings to offer advanced metrics such as Share of Local Voice (SoLV) and Average Rank Position (ARP), which provide deeper strategic insights into your market presence.
- Google Business Profile (GBP) Integration & Audit: A seamless connection to GBP data, including audit features, helps identify optimization opportunities directly from your ranking data.
- User Interface and Ease of Use: The tool should be intuitive and easy to navigate, allowing you to set up scans, interpret data, and generate reports efficiently.
- Pricing Structure: Consider the cost per scan, keyword limits, and overall subscription fees. Look for transparent pricing models, potentially like cost-per-client models for agencies.
- Support and Resources: Good customer support and educational resources can be crucial, especially when you're first learning to leverage geo-grid data.
ProMapRanker, as a robust Local Falcon alternative, offers all these features and more, providing a complete solution for agencies and local businesses to accurately track, analyze, and improve their local search performance. We also offer advanced AI rank tracking to prepare you for the evolving search landscape.
Frequently Asked Questions About Geo-Grid Rank Tracking
How often should I run a geo-grid scan?
The ideal frequency depends on your business's activity and SEO strategy, but generally, running a geo-grid scan weekly or bi-weekly is recommended. This allows you to quickly identify ranking shifts, measure the impact of recent optimizations, and respond to competitor movements without waiting too long for feedback.
Can geo-grid tracking help businesses with multiple
See where you really rank - block by block
ProMapRanker scans Google Maps across a grid of your service area. Simple monthly plans from $19, white-label on every plan.
Start free